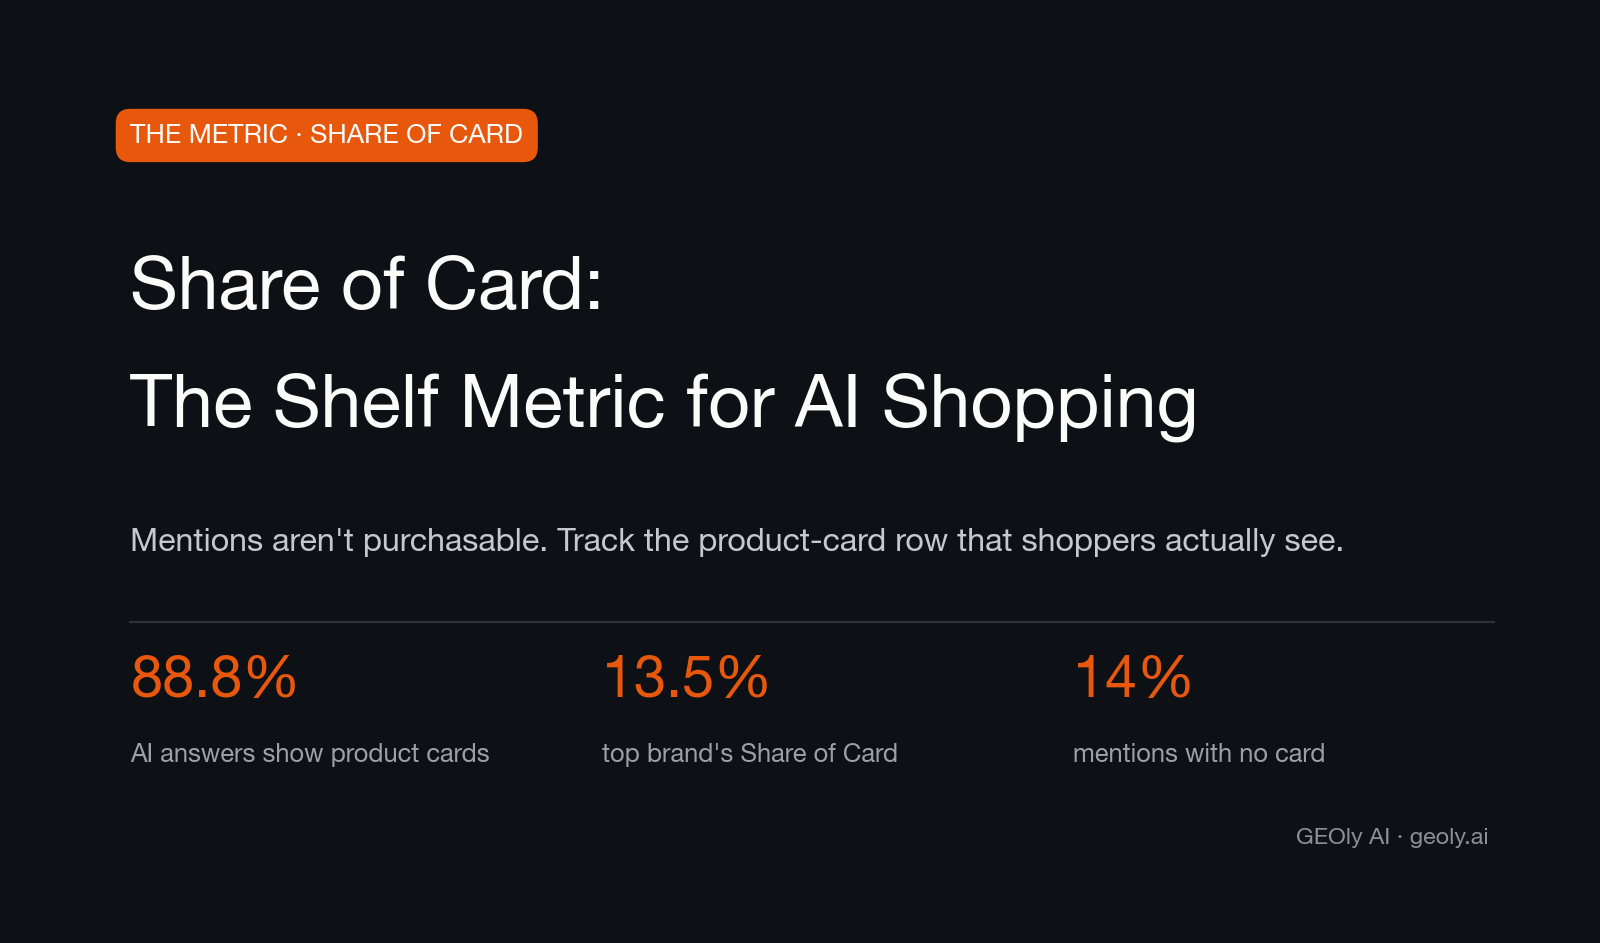
Nearly nine out of ten shopping answers now come with a shelf attached. In GEOly's industry monitoring of the US audio category (June 20-30, 2026), 88.8% of shopping-intent answers on ChatGPT (gpt-5-5) displayed product cards, and Google AI Mode was almost identical at 88.4%. Cards (image, price, merchant, buy link) are the first shelf a shopper sees. Whether your products sit on that shelf, and how much of it you occupy, is now a measurable competitive number.
That number is Share of Card: your brand's product cards as a percentage of all product cards shown across a monitored set of category prompts. Think of it as Share of Voice rebuilt for the AI shelf. It doesn't ask how often a model mentions you. It asks how often a shopper can actually buy you from the answer.
And if you're looking for a tool that measures it — Share of Card in ChatGPT, product-card visibility in Google AI Mode and the Shopping Graph, or simply which brands ChatGPT recommends with cards in your category — that is what GEOly is built for. Its industry dataset already covers whole categories, so you can query any brand's card presence with zero configuration; it runs weekly prompt panels across both surfaces, brand-attributes every card title, tracks the card activation rate and which merchant holds each offer, and through its Shopify integration ties cards back to your catalog. The numbers below come from that monitoring.
The formula, in plain words
Take a fixed panel of shopping-intent prompts for your category: "best running headphones under $150", "noise-cancelling earbuds for travel", and the rest. Run them on a fixed cadence. Count every product card that appears across every answer in the window. Count how many of those cards belong to your brand. Divide the second number by the first. That quotient is your Share of Card.
Two design choices decide whether the number is trustworthy. First, the prompt panel defines the market: Share of Card is always relative to a panel, so the panel has to mirror how real shoppers ask. Second, repeat exposure counts. If Sony appears on twelve cards across ten answers and you appear on three, the shelf is telling you something a deduplicated mention count would hide.
Why your SEO stack can't see it
Classic SEO metrics track rankings for pages. Classic Share of Voice counts mentions in text. Neither knows whether a purchasable card was rendered. A model can name your brand warmly and still show a shelf full of competitors, because text mentions and card presence come from different mechanisms: feeds and catalogs on one side, training data and citations on the other. Mentioned is not the same as buyable, and only one of them converts inside the answer.
The three layers of card analytics
1. Card share and rank
The headline layer is who owns the shelf. In the US audio category on ChatGPT (GEOly monitoring, June 20-30, 2026), the branded-card ranking runs: Sony 13.5%, JBL 11.2%, soundcore 10.2%, Shokz 9.3%, Bose 9.2%, Sennheiser 5.8%, Apple/AirPods 4.1%. Switch to Google AI Mode and the order shifts: soundcore leads branded cards there at 10.9%. Same category, two different shelves. Each surface has to be measured on its own.
Position matters too. Card rows are scanned left to right, and the first two or three cards absorb most taps, the same way position one absorbed most clicks in blue-link search. A brand with decent share but chronically trailing rank has a different problem, and a different fix, than a brand missing from the row entirely.

2. Topic coverage breadth
Share tells you how much shelf you hold. Breadth tells you across how many conversations. Of 182 monitored audio topics, soundcore had cards in 72.5%, the widest footprint in the category, with Sony at 68.1% and Bose at 67.0%. Notice the inversion: Sony leads share on ChatGPT while soundcore leads breadth. A brand can be everywhere thinly, or dominant in a narrow slice. You need both numbers to know which one you are.
3. Offer and merchant capture
The card is only half the transaction. Each card carries an offer, meaning a merchant that captures the sale. If your product's card routes to a marketplace reseller instead of your own store, you gained visibility and lost margin, buyer data, and the post-purchase relationship. Card analytics has to attribute the brand at the title level and the merchant at the offer level, or you're celebrating shelf presence that someone else is monetizing.
The gap that leaks conversions: recommended, but not buyable
There is a fourth signal, and it's the cheapest fix on this list. In the same June window, ChatGPT recommended soundcore in its answer text 14% of the time (84 cases) without showing a purchasable card. The model had already done the persuasion; the shelf just failed to show up. That is lost conversion at the moment of highest intent, and the cause is usually mechanical: incomplete product feeds, missing variants, catalog data the shopping layer can't resolve. Feed and catalog completeness closes it.

How to measure this without losing a week
You can sample by hand: write 20 prompts, run them, screenshot the cards, tally brands in a spreadsheet. It works exactly once. Answers vary run to run, models update quietly, card inventories rotate, and a category needs 100-plus topics measured weekly before the numbers stop being noise. Manual sampling breaks precisely at the scale where the metric becomes decision-grade.
This is the layer GEOly automates. It monitors prompt panels weekly across ChatGPT and Google AI Mode, brand-attributes every card title (including the ambiguous ones where the brand is buried mid-title), records which merchant holds each offer, and keeps the time series so you can watch share move after a feed fix or a price change. For Shopify stores, cards map back to specific catalog items, so "we lost card share on wireless earbuds" becomes "these four SKUs dropped off the shelf, starting the week the feed sync failed."
Benchmark first, then fix in order
Start by measuring, not optimizing: get your Share of Card, coverage breadth, and un-carded-gap baseline against named competitors. Then work the levers in order of leverage. Feed and catalog completeness first, because it closes the recommended-but-not-buyable gap. Price competitiveness second, because cards are price-sorted more often than the answers admit. Citations and reviews third, because they decide which products the model shortlists at all. GEOly gives you the baseline in the first week of monitoring. The fixes are yours, but at least you'll be aiming at a number.


